
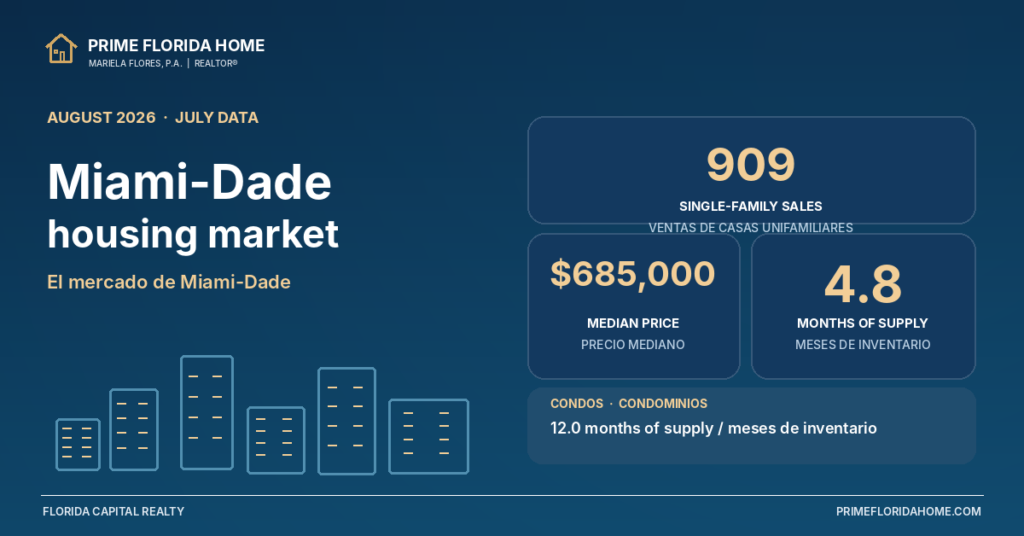
On August 17, MIAMI REALTORS released its July 2026 statistics for Miami-Dade County. This Miami-Dade housing market update for August 2026 looks at what those official figures say, in plain language, for anyone thinking about buying or selling now. I have been in the Miami market since 1995, and I still start with the monthly report, then bring the conversation back to the specific home in front of us.
The Miami-Dade housing market in August 2026, through July’s numbers
For single-family homes in July 2026, the official summary and detail reports show:
| Measure | July 2026 | July 2025 | Change |
|---|---|---|---|
| Closed sales | 909 | 861 | Up 5.6 percent |
| Paid in cash | 193 | 213 | Down 9.4 percent |
| Median sale price | $685,000 | $660,000 | Up 3.8 percent |
| Average sale price | $1,396,322 | $1,265,083 | Up 10.4 percent |
| Dollar volume | $1.3 billion | $1.1 billion | Up 16.5 percent |
| Median percent of original list price received | 95.5 percent | 94.1 percent | Up 1.5 percent |
| Median time to contract | 45 days | 44 days | Up 2.3 percent |
| Median time to sale | 88 days | 85 days | Up 3.5 percent |
| New listings | 1,203 | 1,395 | Down 13.8 percent |
| Active listings | 4,275 | 5,539 | Down 22.8 percent |
| Months of supply | 4.8 | 6.6 | Down 27.3 percent |
Sales are up, the median price is up a little, and there is less to choose from than a year ago. Time to contract, at 45 days, is almost unchanged. Sellers are receiving a slightly higher share of the original list price, a median of 95.5 percent.
Townhouses and condos: more sales, still more supply
Townhouses and condos tell a different story. In July 2026:
| Measure | July 2026 | July 2025 | Change |
|---|---|---|---|
| Closed sales | 1,026 | 921 | Up 11.4 percent |
| Paid in cash | 487 | 449 | Up 8.5 percent |
| Median sale price | $400,000 | $406,000 | Down 1.5 percent |
| Average sale price | $689,289 | $838,728 | Down 17.8 percent |
| Dollar volume | $707.2 million | $772.5 million | Down 8.4 percent |
| Median percent of original list price received | 93.1 percent | 92.7 percent | Up 0.4 percent |
| Median time to contract | 86 days | 65 days | Up 32.3 percent |
| Median time to sale | 125 days | 107 days | Up 16.8 percent |
| Active listings | 11,324 | 12,838 | Down 11.8 percent |
| Months of supply | 12.0 | 14.1 | Down 14.9 percent |
Condo sales rose, and inventory came down, but buyers still have more time. A median of 86 days to contract is almost three months. The median price eased slightly, to $400,000, and the average fell more sharply, which can happen when the mix of sales changes.
The combined picture
The August 17 news release from MIAMI REALTORS + RWorld put the two sides together. Total home sales in July were 1,935, up 8.6 percent from 1,782 a year earlier. The association said that was the 11th consecutive month of year-over-year gains. In the same release, 4.8 months of single-family supply is described as a seller’s market, 12 months of condo supply as a buyer’s market, and a balanced market as six to nine months of supply. I am using that definition as they published it, not inventing a new one.
If your search includes northern Tamiami, those county figures are the backdrop, not a substitute for the zip. I looked at the second-quarter single-family numbers for zip code 33182 earlier this month, and the local guide is on my Tamiami 33182 page.
What this means, calmly
For single-family buyers, there is less to choose from than last July, and prices moved up a little. You can still be thoughtful. Forty-five days to contract is not a weekend rush. For single-family sellers, tighter inventory can help, but pricing still has to make sense next to recent sales. A median of 95.5 percent of original list price is not the same as every home selling at the asking price.
For condo buyers, 12.0 months of supply still gives you room to read, compare, and negotiate. Ask for the building’s current reserve study, the status of any milestone or structural inspection, and the insurance, because those documents still shape financing and monthly costs. For condo sellers, sales are up and supply is down from a year ago, but the market remains slower than the single-family side, so preparation and a realistic list price matter.
Your experience will depend on the property, the building, and the price range, not on a county average alone. There is no need to make a decision just because a monthly report came out.
The bottom line
July’s numbers show a tighter single-family market and a condo market that is more active than last year, with 12 months of supply still on the books. If you want to look at what that means for your home or your search, I am happy to go over the recent sales with you, at your pace and with no pressure.
References
- MIAMI REALTORS, Miami-Dade County Single-Family Homes, July 2026 Summary and Detail, released Monday, August 17, 2026
- MIAMI REALTORS, Miami-Dade County Townhouses and Condos, July 2026 Summary
- MIAMI REALTORS + RWorld, Miami-Dade Total Home Sales Rise for 11th Consecutive Month, August 17, 2026
- Tabular recap: South Florida Market Stats, July 2026
You can reach me at (305) 409-2815 or mflores@primefloridahome.com. Mariela Flores, P.A., Florida Capital Realty.
Warmly,
Mariela
Restored to our archive in 2026, reflecting the market as of August 2026